Prometheus基础概念及PromSQL
一、简介
prometheus 是一个开源的系统监控和告警的工具包,其采用pull方式采集时间序列,通过http协议传输。
prometheus的优势在于,它是一个基于服务的告警系统,针对不同的服务,有不同的exporter,可以实现不一样的效果。
最初由SoundCloud发布。它通过HTTP协议从远程的机器收集数据并存储在本地的时序数据库上。它提供了一个简单的网页界面、一个功能强大的查询语言以及HTTP接口等等。
Prometheus可以通过安装在远程机器上的exporter来收集监控数据。
官网:https://prometheus.io/ Github:https://github.com/prometheus/prometheus
二、架构
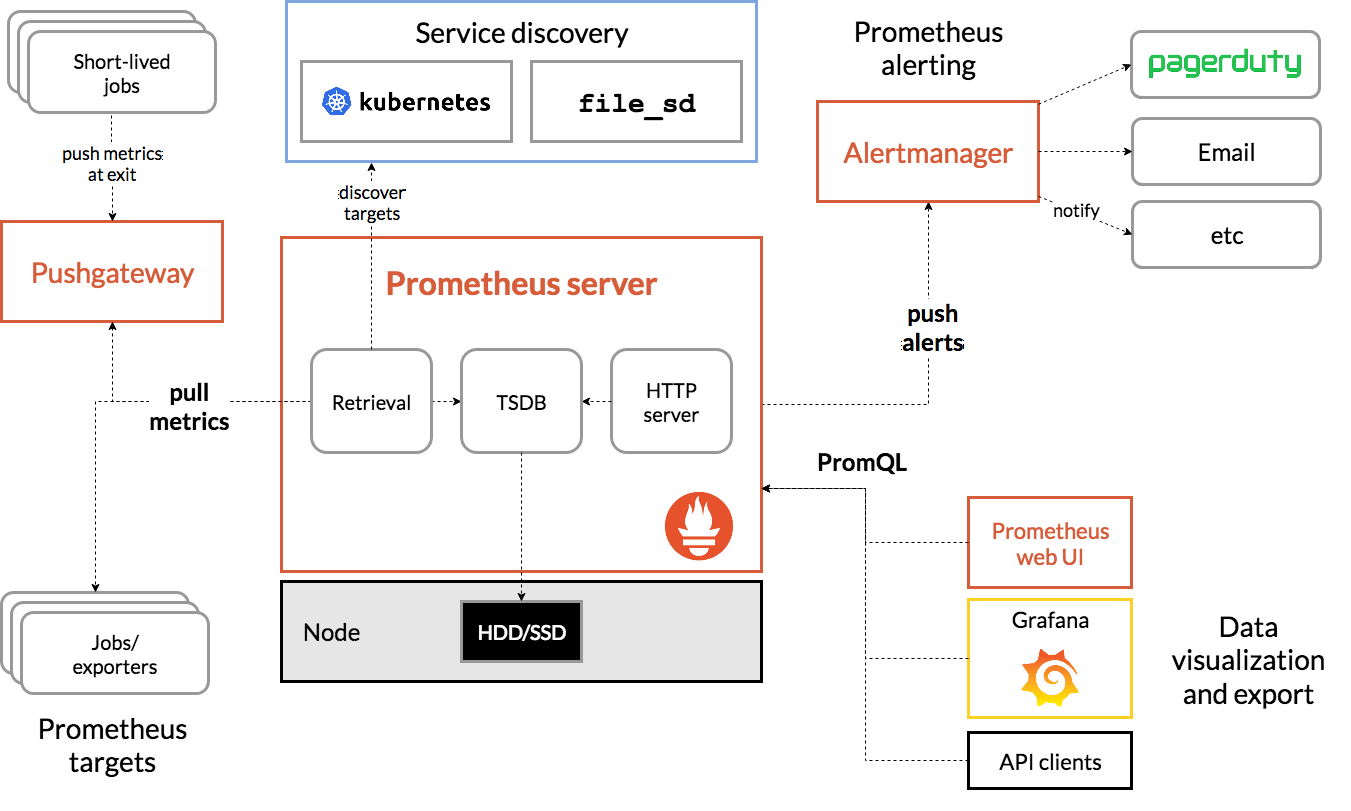
- prometheus的核心是一个时间序列数据库,我们可以通过它抓取并存储数据,并通过prometheus定义的一些查询语句来获取我们需要的数据
- exporter的核心是一个静态web,通过不断更新的静态web暴露metric值
- alertmanager是一个报警接口,接收prometheus推送的告警,并通过自己定义的一些规则去进行告警
- Pushgateway 程序,主要是实现接收由Client push过来的指标数据,在指定的时间间隔,由主程序来抓取
三、存储方式
Prometheus提供了两种存储方式,分别是本地存储和远端存储
Prometheus本地存储简介
Prometheus的本地存储被称为Prometheus TSDB,目前是V3版本,根据官方介绍其有着非常高效的时间序列数据存储方法,每个采样数据仅占3.5byte左右空间,上百万条时间序列,30s间隔,保存60天,仅占200多G空间
默认情况下,Prometheus将采集到的数据保存在本地的TSDB数据库中,默认目录为Prometheus安装目录下的data目录。数据写入过程为先把数据写入wal日志并放在内存中,然后2个小时后将内存数据放入一个新的block块,同时再把新的数据写入内存并在2小时后再保存至一个新的block块,依次类推
涉及到两个组成部分:block和wal
block Prometheus TSD将存储的监控数据按时间分割为block,block的大小并不固定,默认最小的block保存2h的数据,随着数据量的不断增加,TSDB会将小的block合并为大的block,例如将3个2h的block合并为一个6h的block,这样不仅可以减少数据存储,还可以减少block个数,便于对数据进行检索。
在实际存储中,block就是Prometheus TSDB数据目录下那些以01开头的存储目录。block主要包含4个部分:chunks、index、meta.josn、tombstones
chunks,主要用于保存压缩后的时序数据。每个chunk的大小为512M,如果超过,则会被分割为多个chunk保存,且以数字编号命名
index,是为了对时序数据进行快速检索和查询而设计,主要用来记录chunk中时序的偏移位置
meta.json,记录block的元数据信息,主要包括一个数据块记录样本的起始时间、截至时间、样本数、时序数和数据源等信息,这些元数据信息在后期对block进行维护(删除过期block、合并block等)时会用到。
tombstones,用于对数据进行软删除。TSDB在删除block数据块时会将整个目录删除,但如果只删除一部分数据块的内容,则可以通过 tombstones进行软删除
WAL WAL(write-ahead logging,预写日志)是关系型数据库中利用日志来实现事务性和持久性的一种技术,即在进行某个操作之前先将这件事情记录下来,以便之后对数据进行回滚、重试等操作并保证数据可靠性。
Prometheus为了防止丢失暂存在内存中的还未被写入磁盘的监控数据’、引入了WAL机制。WAL被分割为默认大小为128M的文件段,文件段以数字命名,例如00000001、00000002等,以此类推。
按照每种对象设定的采集周期,Prometheus会将周期性采集的监控数据先写入head-block中,但这些数据没有被持久化,TSDB通过WAL将提交的数据先保存到磁盘中,在TSDB宕机重启后,会首先启动多协程读取WAL,从而恢复之前的状态。
另外从Prometheus v2.19.0开始,Prometheus引入了内存映射,将head-block中已填充的完整的chunk,刷新到磁盘(即保存在chunks_head目录下的数据)并从磁盘进行内存映射,同时仅将引用存储在内存中。通过内存映射,可以在需要时使用该引用将chunk动态加载到内存中。这是操作系统提供的功能。通过引入内存映射,减少了Prometheus的内存消耗,虽然填充完毕的chunk会被刷到磁盘上,但是对于该部分的操作预写入日志不会被删除,直到该chunk所属的block完整落盘
四、Metrics数据模型
Prometheus 中存储的数据为时间序列,是由 metric 的名字和一系列的标签(键值对)唯一标识的,不同的标签则代表不同的时间序列
metric :该名字应该具有语义,一般用于表示 metric 的功能,例如:http_requests_total, 表示 http 请求的总数。
metric 名字由 ASCII字符,数字,下划线,以及冒号组成,且必须满足正则表达式 [a-zA-Z_:][a-zA-Z0-9_:]*标 签:使同一个时间序列有了不同维度的识别。例如 http_requests_total{method="Get"} 表示所有 http 请求中的 Get 请求。当 method="post" 时,则为新的一个 metric。
标签中的键由 ASCII字符,数字,以及下划线组成,且必须满足正则表达式 [a-zA-Z_:][a-zA-Z0-9_:]*。样 本:实际的时间序列,每个序列包括一个 float64 的值和一个毫秒级的时间戳。
格式:<metric name>{<label name>=<label value>, …},

例如:http_requests_total{method="POST",endpoint="/api/tracks"}。
五、Metrics类型
Counter:只增不减的计数器
- 计数器可以用于记录只会增加不会减少的指标类型。比如记录应用请求的总量,cpu使用时间等
- 对于Counter类型的指标,只包含一个inc()方法,用于计数器+1
- 一般而言,Counter类型的metrics指标在命名中我们使用_total结束,如http_requests_total
Gauge:可增可减的仪表盘
- 对于这类可增可减的指标,可以用于反应应用的当前状态。例如在监控主机时,主机当前空闲的内存大小,可用内存大小。或者容器当前的cpu使用率,内存使用率。
- 对于Gauge指标的对象则包含两个主要的方法inc()以及dec(),用户添加或者减少计数。
Histogram:自带buckets区间用于统计分布统计图
- 主要用于在指定分布范围内(Buckets)记录大小或者事件发生的次数。
Summary::客户端定义的数据分布统计图
- Summary和Histogram非常类型相似,都可以统计事件发生的次数或者大小,以及其分布情况。
- Summary和Histogram都提供了对于事件的计数_count以及值的汇总_sum。 因此使用_count,和_sum时间序列可以计算出相同的内容,例如http每秒的平均响应时间:rate(basename_sum[5m]) /rate(basename_count[5m])。
- 同时Summary和Histogram都可以计算和统计样本的分布情况,比如中位数,9分位数等等。其中 0.0<= 分位数Quantiles <= 1.0。
- 不同在于Histogram可以通过histogram_quantile函数在服务器端计算分位数。 而Sumamry的分位数则是直接在客户端进行定义。
- 因此对于分位数的计算。 Summary在通过PromQL进行查询时有更好的性能表现,而Histogram则会消耗更多的资源。相对的对于客户端而言Histogram消耗的资源更少。
六、PromSQL查询语法
1、查询语法规则
```

## 2、时间范围查询

- **查询瞬时向量**

  ```bash
  # 瞬时向量表达式,选择当前最新的数据
  node_uname_info
  # 瞬时向量表达式,选择当前最新的数据
  node_uname_info{}
查询范围向量
# 查询以当前时间为基准,5分钟内的数据
node_uname_info [5m]
查询位移时间的向量
# 查询以当前时间为基准,1小时前的瞬时样本数据
node_uname_info offset 1h
综合查询
# 查询以当前时间为基准,1小时前1小时内的数据
node_uname_info [1h] offset 1h
时间范围查询支持的时间单位:
ms: 毫秒s:秒m:分支h:小时d: 天(24小时)w:周(7天)y:年(365天)
七、配置
1、配置Prometheus
①检查配置文件语法
promtool check config /etc/prometheus/prometheus.yml
②在运行时重载配置文件
在启动prometheus时添加参数:
prometheus \
    --config.file=/opt/prometheus/prometheus.yml \
    --storage.tsdb.path=/data/prometheus/data \
    --web.enable-lifecycle
然后通过Reastful接口触发重载配置文件
curl -XPOST http://127.0.0.1:9090/-/reload
或者给prometheus进程发送SIGHUP信号
kill -HUP prometheus进程号
如果变更后的配置文件语法有错误,则不会重载生效。触发重载前,可使用promtool check检查配置文件语法。
参考:https://prometheus.io/docs/prometheus/latest/configuration/configuration/#%3Cscrape_config%3E
2、配置node_exporter
参考文档:https://prometheus.io/docs/guides/node-exporter/
scrape_configs:
  - job_name: 'node'
    static_configs:
    - targets:
      - 部署node_exporter主机IP地址:9100
      - 部署node_exporter主机IP地址:9100
3、配置blackbox_exporter
参考文档:https://github.com/prometheus/blackbox_exporter#prometheus-configuration
scrape_configs:
  - job_name: "blackbox"
    scrape_interval: 10s
    scrape_timeout: 5s
    metrics_path: /probe
    params:
      module: [http_2xx]
    static_configs:
    - targets:
      - http://代探测的URL
    relabel_configs:
    - source_labels: [__address__]
      target_label: __param_target
    - source_labels: [__param_target]
      target_label: instance
    - target_label: __address__
      replacement: 部署blackbox_exporter主机IP地址:9115
八、API
目前,Prometheus API 的稳定版本为V1,针对该API的访问路径为 /api/v1。API支持的请求模式有GET和POST两种,当正常响应时,会返回2xx的状态码。当API正常响应后,将返回如下的Json数据格式。反之,当API调用失败时,则可能返回以下几种常见的错误提示码:
- 400 Bad Request 参数丢失或不正确时出现。
- 422 Unprocessable Entity 当表达无法被执行时。
- 503 Service Unavailiable 查询超时或中止时。
请求参数格式
- query=
: Prometheus expression query string. - time=
: Evaluation timestamp. Optional. - timeout=
: Evaluation timeout. Optional. Defaults to and is capped by the value of the -query.timeout flag.
1、admin api
默认情况下,管理时间序列 API 是被禁用的,在 Prometheus 的启动参数中添加--web.enable-admin-api参数启用
①删除时间序列指标
PUT /api/v1/admin/tsdb/delete_series

参数:
  match[]=<series_selector> : Metrics的名称
  start=<rfc3339 | unix_timestamp> : 开始的时间戳
  end=<rfc3339 | unix_timestamp> : 结束的时间戳

# 删除某个标签匹配的数据
$ curl -X POST -w "%{http_code}" 'http://localhost:9090/api/v1/admin/tsdb/delete_series?match[]={instance=".*"}'
# 删除某个指标数据
$ curl -X POST -w "%{http_code}" 'http://localhost:9090/api/v1/admin/tsdb/delete_series?match[]={node_load1=".*"}'
# 根据时间删除
$ curl -X POST -w "%{http_code}" 'http://localhost:9090/api/v1/admin/tsdb/delete_series?match[]={node_load1=".*"}&start<2023-08-23T05:33:24.637Z&end=2023-08-23T05:33:35.637Z'
②删除软删除的数据
从磁盘中删除已删除的数据,并清理现有的逻辑删除。还可以在删除操作后释放空间。
POST /api/v1/admin/tsdb/clean_tombstones
PUT /api/v1/admin/tsdb/clean_tombstones

# 成功则返回 204 的请求状态码
$ curl -s  -XPOST -w "%{http_code}" http://localhost:9090/api/v1/admin/tsdb/clean_tombstones
2、resource api
①查询某一时刻的metrics数据
GET /api/v1/query
POST /api/v1/query

参数:
    query=<string>: Prometheus 表达式查询字符串。
    time=<rfc3339 | unix_timestamp>: 时间戳,可选参数。
    timeout=<duration>:  查询超时设置,可选参数,默认将使用-query.timeout的全局参数。

$ curl -s 'http://localhost:9090/api/v1/query?' \
    -d 'query=up{instance="localhost:9090"}' \
    -d 'time=2023-08-23T08:01:00.001Z' | jq -r '.'
②查询metrics时间范围内的数据
GET /api/v1/query_range
POST /api/v1/query_range

参数:
    query=<string>: Prometheus 表达式查询字符串。
    start=<rfc3339 | unix_timestamp>: 开始时间戳,可选参数
    end=<rfc3339 | unix_timestamp>: 结束时间戳,可选参数
    step=<duration | float>: 查询解析步长,采用持续时间格式或浮点秒数
    timeout=<duration>: 查询超时设置,可选参数,默认将使用-query.timeout的全局参数。

$ curl -s 'http://localhost:9090/api/v1/query_range?' \
        -d 'query=up' \
        -d 'start=2023-08-23T08:01:00.001Z' \
        -d 'end=2023-08-23T08:30:00.001Z' \
        -d 'step=15s' | jq -r '.'
③格式化查询metrics数据
GET /api/v1/format_query
POST /api/v1/format_query

参数:
    query=<string>: Prometheus 表达式查询字符串。

$ curl -s 'http://localhost:9090/api/v1/format_query?query=foo/bar' | jq -r '.'
④根据标签查询metrics数据
GET /api/v1/series
POST /api/v1/series

参数:
  match[]=<series_selector>: 至少提供一个 match[]
  start=<rfc3339 | unix_timestamp>: 开始时间戳,可选参数
  end=<rfc3339 | unix_timestamp>: 结束时间戳,可选参数

$ curl -s 'http://localhost:9090/api/v1/series?' \
        -d 'match[]=up' \
        -d 'match[]=node_disk_io_now{job="node_exporter"}' | jq -r '.'
⑤查询metrics的标签
GET /api/v1/labels
POST /api/v1/labels

参数:
  match[]=<series_selector>: 可选
  start=<rfc3339 | unix_timestamp>: 开始时间戳,可选参数
  end=<rfc3339 | unix_timestamp>: 结束时间戳,可选参数

$ curl -s 'http://localhost:9090/api/v1/labels?' | jq -r '.'
$ curl -s 'http://localhost:9090/api/v1/labels?' \
        -d 'match[]=up' | jq -r '.'
⑥查询标签的值
GET /api/v1/label/<label_name>/values

参数:
  match[]=<series_selector>: 可选
  start=<rfc3339 | unix_timestamp>: 开始时间戳,可选参数
  end=<rfc3339 | unix_timestamp>: 结束时间戳,可选参数

$ curl -s 'http://localhost:9090/api/v1/label/job/values' | jq -r '.'
⑦查询 Target
GET /api/v1/targets
参数:
  state=<any | active | dropped>: target的状态
    scrapePool==<string>:
$ curl -s http://localhost:9090/api/v1/targets?state=active | jq -r '.'
⑧查询配置文件
GET /api/v1/status/config

$ curl -s http://localhost:9090/api/v1/status/config | jq -r '.'
⑨查询启动的参数
GET /api/v1/status/flags

$ curl -s http://localhost:9090/api/v1/status/flags | jq -r '.'
⑩查询TSDB的状态
$ curl -s http://localhost:9090/api/v1/status/tsdb | jq -r '.'
⑪查询 WAL 重放状态
GET /api/v1/status/walreplay

$ curl -s http://localhost:9090/api/v1/status/walreplay | jq -r '.'